
Understanding Google traffic analytics is critical for the continued progress and improvement of your website, and likely the increase in your online sales. The data points tell you how people are using your website right now (whether it’s the way you intended for them to use it or not). This article will help you set up and understand google traffic analytics.
Using these metrics, you can create goals determining how you want users to use your website, and make attainable goals for the numbers you want to improve! This is key to the development of your website and your business overall.
The goal today is to get you set up with analytics software and teach you how to read the data points that you NEED to succeed!
To start, you need an analytics platform that allows you to collect the data you need. We recommend Google Analytics. It’s free, easy to set up, and the user interface is pretty straightforward.
There is plenty of other analytics software out there that may have more bells and whistles. If you’re looking to spend a pretty penny, you can look at Adobe Analytics, Angelfish Actual Metrics, and AWStats. These are great alternatives, but for simplicity’s sake, we’ll stick with Google Analytics and help you get set up.
If you already have analytics software that you’re happy with, you can skip the next section!
Setting up Google Analytics
Let’s get started! We’re going to give a brief guide to help you get Google Analytics up on your website so you can start collecting data.
1. Go to https://www.google.com/analytics/
2. On the top right-hand side, there’s a login drop-down.
3. Select analytics.
4. Log in to the Google account you want to use to collect website data or create one if needed.
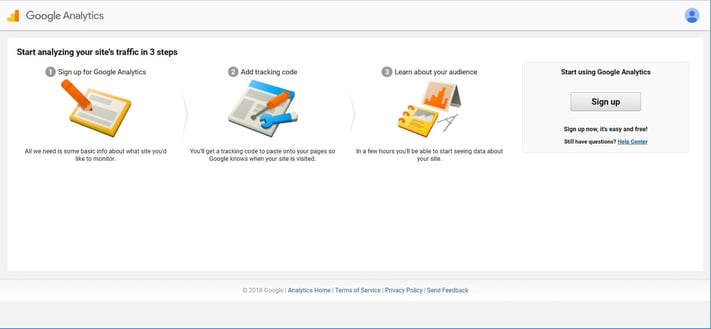
5. You'll come to this page.
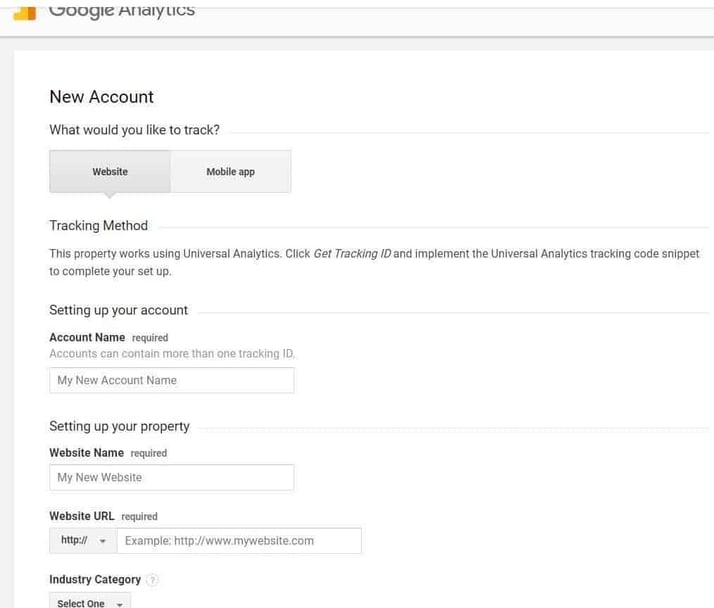
6. You can choose to set up analytics for a website or a mobile app with Google analytics. We'll choose the website and fill out the information.
- Account name – this should be either your company name or your name if you’re managing websites for multiple companies
- Website name – the name of the website you’ll be tracking. Label it if you have multiple sites you’ll be tracking (Company Name Main Website, Company Name Blog, etc.)
- Website URL – the URL of the website you’ll be tracking
- Industry category – choose the industry that you are part of
- Reporting time zone – your time zone
- Data sharing settings – I recommend keeping all of these checked. They may come in handy in the future!
7. Once you submit the form, you'll accept the terms of service, and then you'll receive your tracking ID. This should be added to the header of each page of your website that you want to be tracked, mostly landing pages and conversion pages. You may need your developer to do this for you.
I set up Google Analytics for a friend’s website recently. To me, the initial interface is a little confusing. The longer you’re in there, the better you understand it. If you’re still struggling, here’s a great guide to Google Analytics!
The Dashboard
Now we can talk about the dashboard! This is KEY to understanding google traffic analytics. You’re able to customize the dashboard to fit your needs and see the metrics that are most important to you. We’ve talked about some of the metrics you should be using, so let’s make sure you can find them.
When you log into your Analytics account again, you should be on a tab that says ‘All Web Site Data’ and looks like the screen below:
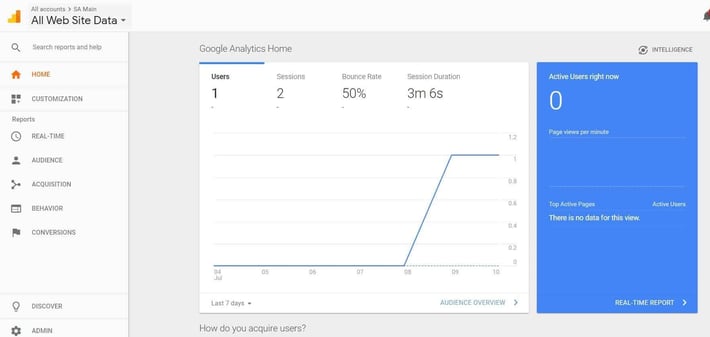
As you scroll down, you’ll see other metrics available on this page. Really, this page will have all of the data points on it that we want to focus on: #users, bounce rate, how long people are staying on the website, and where they are coming from.
If you want to set up your own dashboard, click ‘Customization’ on the navigation bar to the left and click ‘Dashboards’. On this page, you can play around and create your own dashboards to include the metrics you want to see. Create as many as you want! These can be a little more intensive to set up, but if there are specific data points you’re looking for, this is a great way to set up the visual presentation.
These dashboards also allow you to segment out based on multiple criteria offered by Google Analytics. So if you want to look only at the metrics for direct traffic to your site, you are able to create that segment.
The dashboard is an overview of the capabilities of Google Analytics. You’ll notice more options in the navigation bar on the left, especially under reports. You can dive deeper into who your audience is, how you are getting your customers, their behavior on your site, and conversion information!
Understanding Google Traffic Analytics
The Metrics
What metrics should you pay attention to? It doesn’t matter what analytics platform you’re using, make sure you have access to these data points.
Let’s Talk Pages
You can see what pages your visitors are seeing most by scrolling to the bottom of the Home Dashboard. You’ll see the page name, pageviews, and page value initially. If you click on the ‘Pages Report’ on that chart, you’ll be taken to a much more informative page.
Scroll past the first graph, and let’s check out the chart below it. Each page is given data for unique pageviews, time on page, bounce rate, and the value of the page. These are some of the critical criteria that you’ll want to pay attention to as we make efforts to improve traffic and conversions on your site! Broken down by each page, you can see what landing pages are making you money, which ones are keeping people on your website, and where you need to refresh content.
On this page, you can create a segment based on the criteria that you choose if you’re interested.
Where Your Traffic (and Money) Is Coming From
Back to the Home Dashboard! We want to know traffic sources and value now. The second chart on the page will show your Traffic Channels. Let’s click on ‘Acquisition Report’ to get a better look at the data.
Initially, we can see how many users come from each source (specific URLs typical) and can determine the quality of that referral traffic. Take note of the session duration, bounce rate, and # of new users coming from each source.
Looking at this data by URL is helpful when getting into the nitty-gritty of data, but what if we don’t need it to be that specific? On that left navigation bar, you’ll see that the ‘Acquisition’ tab has been opened. We’re currently on the ‘Referrals’ tab under it. Go to ‘Channels’ where traffic is broken down by Referral, Organic Search, Email, Paid Search, etc.
This is critical information. If you’re getting a ton of traffic from FB, that’s the insight that your audience is there. Now you can put advertising dollars there or create compelling content that you share primarily on FB to drive leads.
For a more in-depth understanding of Google traffic analytics, read this article.
Now you understand how to set up analytics (if you didn’t have them set up before) and what data points you should understand and hopefully how to find them!
Keep in mind, that this is a very high-level overview of Google Analytics, only going over the most basic features.
In the next post, we’re going to learn how to set and track goals in Google Analytics, and set our own goals for increasing traffic!
 Drive More Visibility, Traffic, and Sales

 Accessibility